Persefoni Pro

Democratizing Carbon Accounting

Democratizing Carbon Accounting

Problem

Problem

Carbon accounting is complex and time-intensive. If you're not a sustainability professional, you likely don't even know where to begin.

Many organizations either need to (due to regulation) or want to (for values or stakeholder pressure) calculate their carbon footprint, but the barrier to entry, both in complexity and cost, is too high.

So we got to thinking…

So we got to thinking…

What if we could empower any organization, in any industry, to calculate their carbon footprint?

What if we could make it a simple, guided, step-by-step experience that makes it impossible to get lost?

What if we could eliminate the barriers, technical, financial, and educational, that prevent organizations from taking climate action?

Role

Principal Product Designer

Timeline

3 months

Impact

6,000 orgs using tool

A view of an elegant "Scope 3" kanban dashboard
An "Electricity Usage" dashboard
A Footprint Analytics detail view.
A profile view for a climate company
A view for managing vehicle usage in a carbon accounting tool
A view for adding data in for "Business Travel" in a carbon accounting tool
A map view for adding locations in for a carbon accounting tool
A view for managing equipment in a carbon accounting application

Metrics for success

To guide our launch and measure early traction, we identified a few key indicators of success

📈

2,000 organizations onboarded within the first year

This target was based on market sizing from our sales team and our strategy to capture the long tail of smaller organizations looking for a simplified carbon accounting solution.

👥

250+ monthly active users (MAUs)

Because carbon footprint tracking typically follows an annual cycle, our goal was to sustain a healthy core of active users engaging monthly, especially during key reporting windows.

💬

Tangible feedback showing ease and clarity

Beyond quantitative metrics, we aimed to gather direct user feedback signaling that Persefoni Pro made carbon tracking simple, intuitive, and actionable , a marked improvement over legacy tools or spreadsheets.

Requirement Definition

Requirement Definition

Persefoni’s goal was to lead the carbon accounting market. We had gained traction with our enterprise offering for organizations that:

  • Had dedicated sustainability teams who understood what they needed

  • Had the budget to commit to enterprise-level agreements

But a huge segment was being left behind. These were small and mid-sized organizations that needed or wanted to calculate their carbon footprint, but lacked the resources, knowledge, or budget to do so.

A view of an enterprise tool, showing a table

Enterprise Offering

A view of a modern, simple carbon accounting dashboard

Free Tier

Our tool needed to be:

Our tool needed to be:
  • Simple and supportive – Designed for users with zero sustainability experience

  • Accurate and credible – Not just another footprint estimator, but a true, reportable, auditable carbon footprint

  • Free (to try) – No upfront cost. Users could explore, get value, and upgrade only if and when it made sense for them

Journey Mapping

Journey Mapping

With the problem and goals in focus, we got to work mapping the user journey. Education and guidance were key. We needed to hold the user’s hand through every step, especially at the start. Our journey included:

  1. Onboarding – Collect essential business info to auto-populate carbon accounting details later

  2. Education – Introduce key concepts and terminology in a lightweight, digestible way

  3. Data Collection – Gather deeper insights like locations, equipment, and vehicles to power the footprint calculation

  4. Calculation – With the foundational data in place, users could generate a footprint by entering just a few data points per asset

  5. Post-Calculation Actions – After calculating their footprint, users enter a more open-ended experience. This also introduces opportunities for monetization. Post calculation, users should be able to:

We mapped this journey in FigJam, and wireframed key steps along the way to clarify the interaction design.

Sticky notes that form a  user journey

User Interviews

User Interviews

Once the journey was shaped, we interviewed potential users for feedback.

This step was critical. We needed signal from real users that this was the right approach.

One of my favorite product design principles came into play here:

A dollar in ideation costs 10 dollars in design and 100 dollars in development.

Validating early helps reduce risk and ensures we are solving the right problem in the right way.

A view of a spreadsheet showing user interview notes

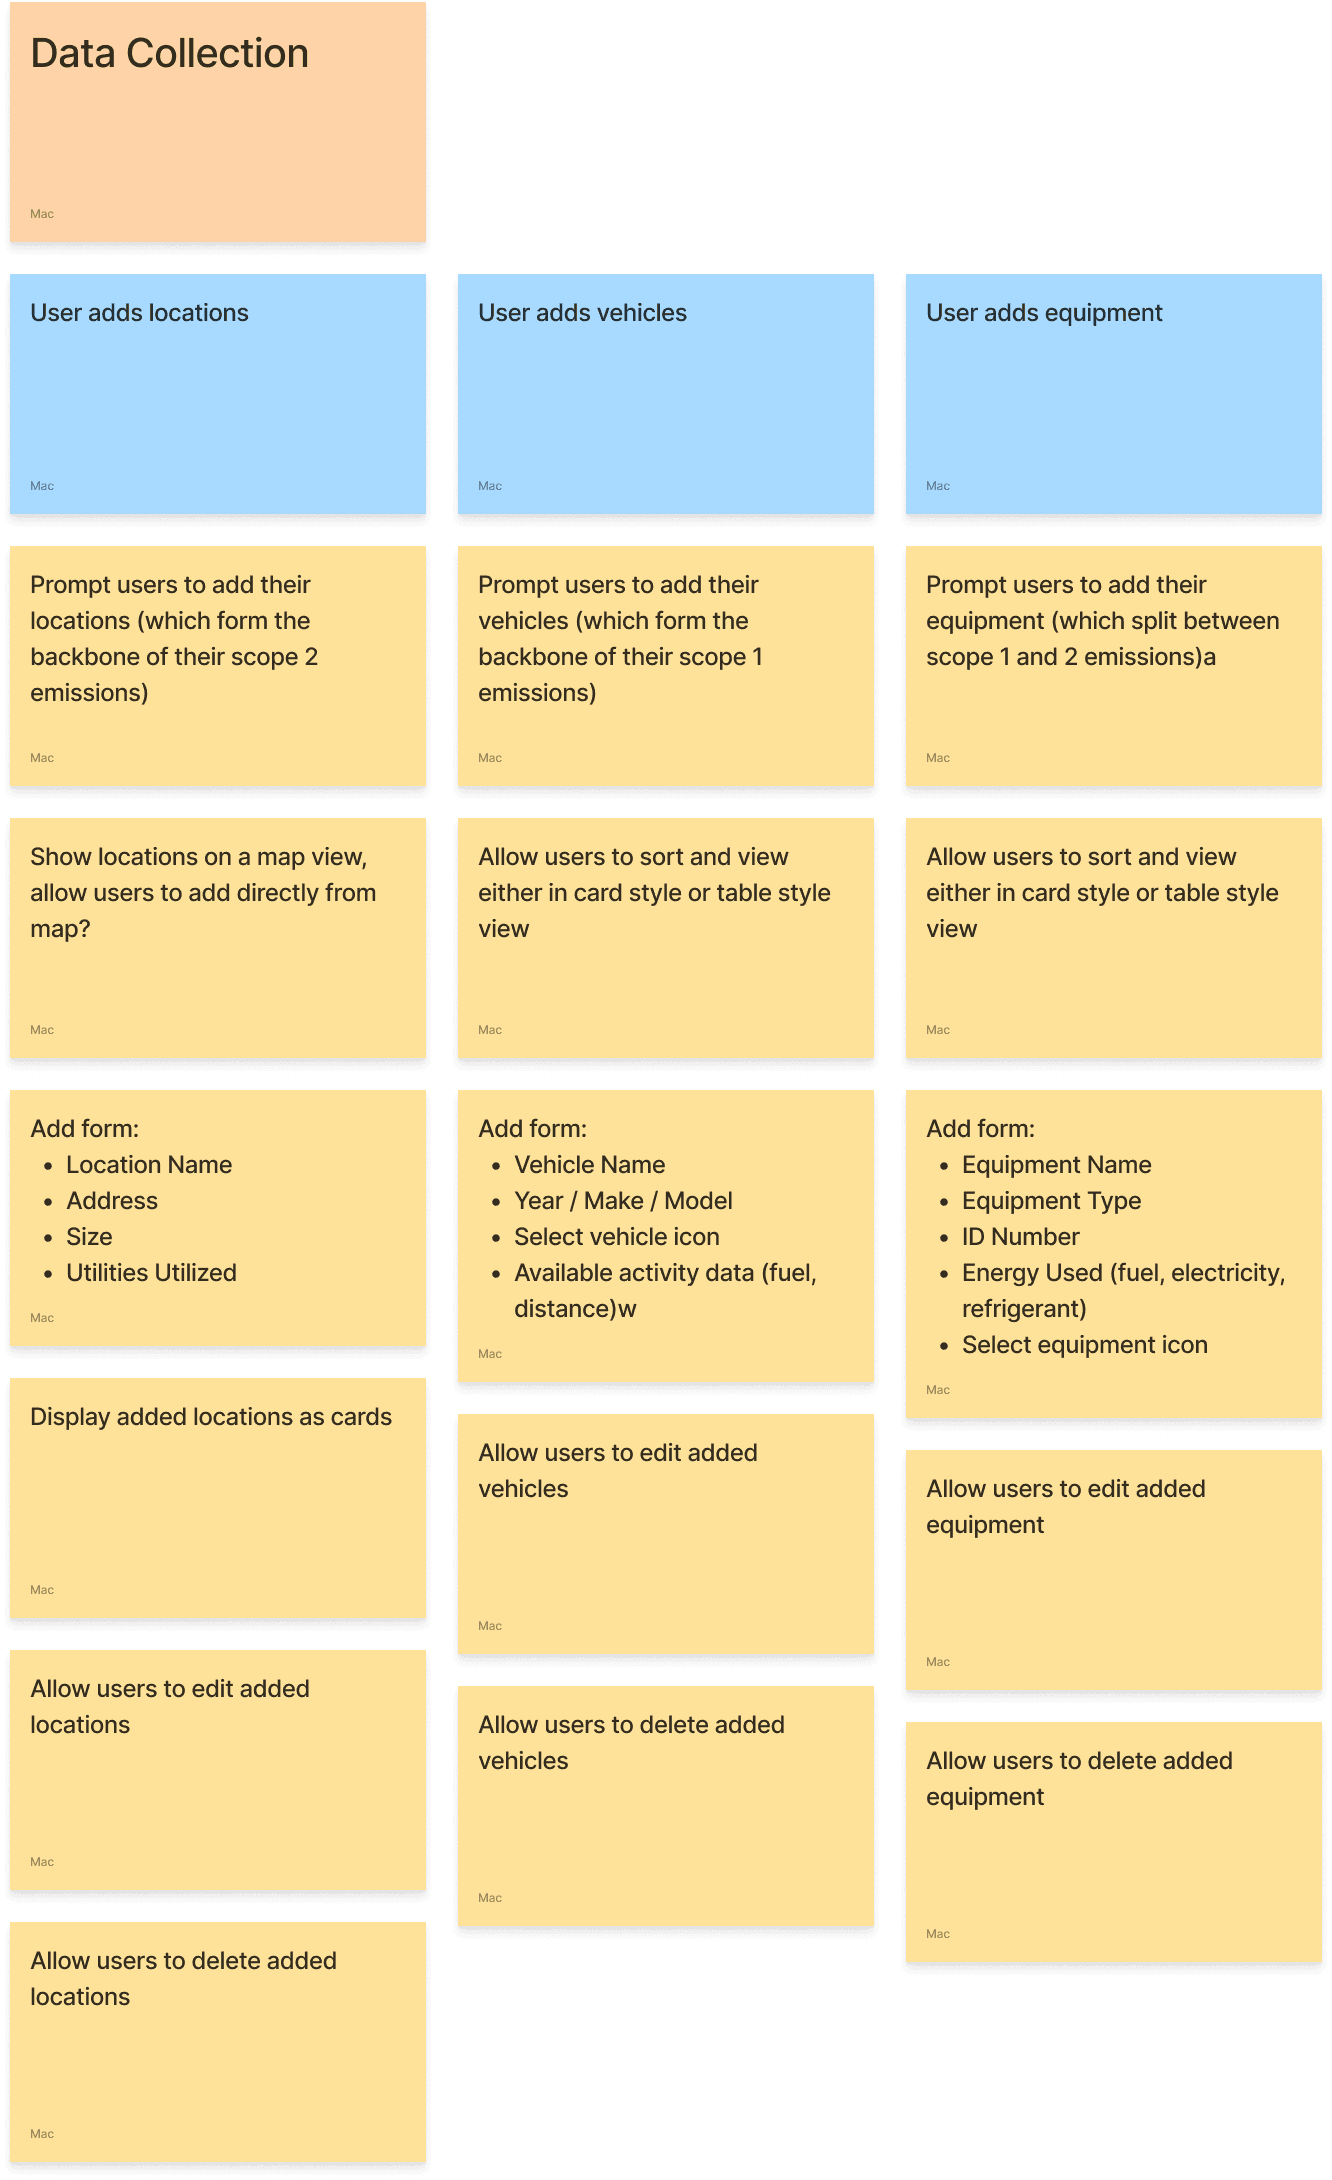
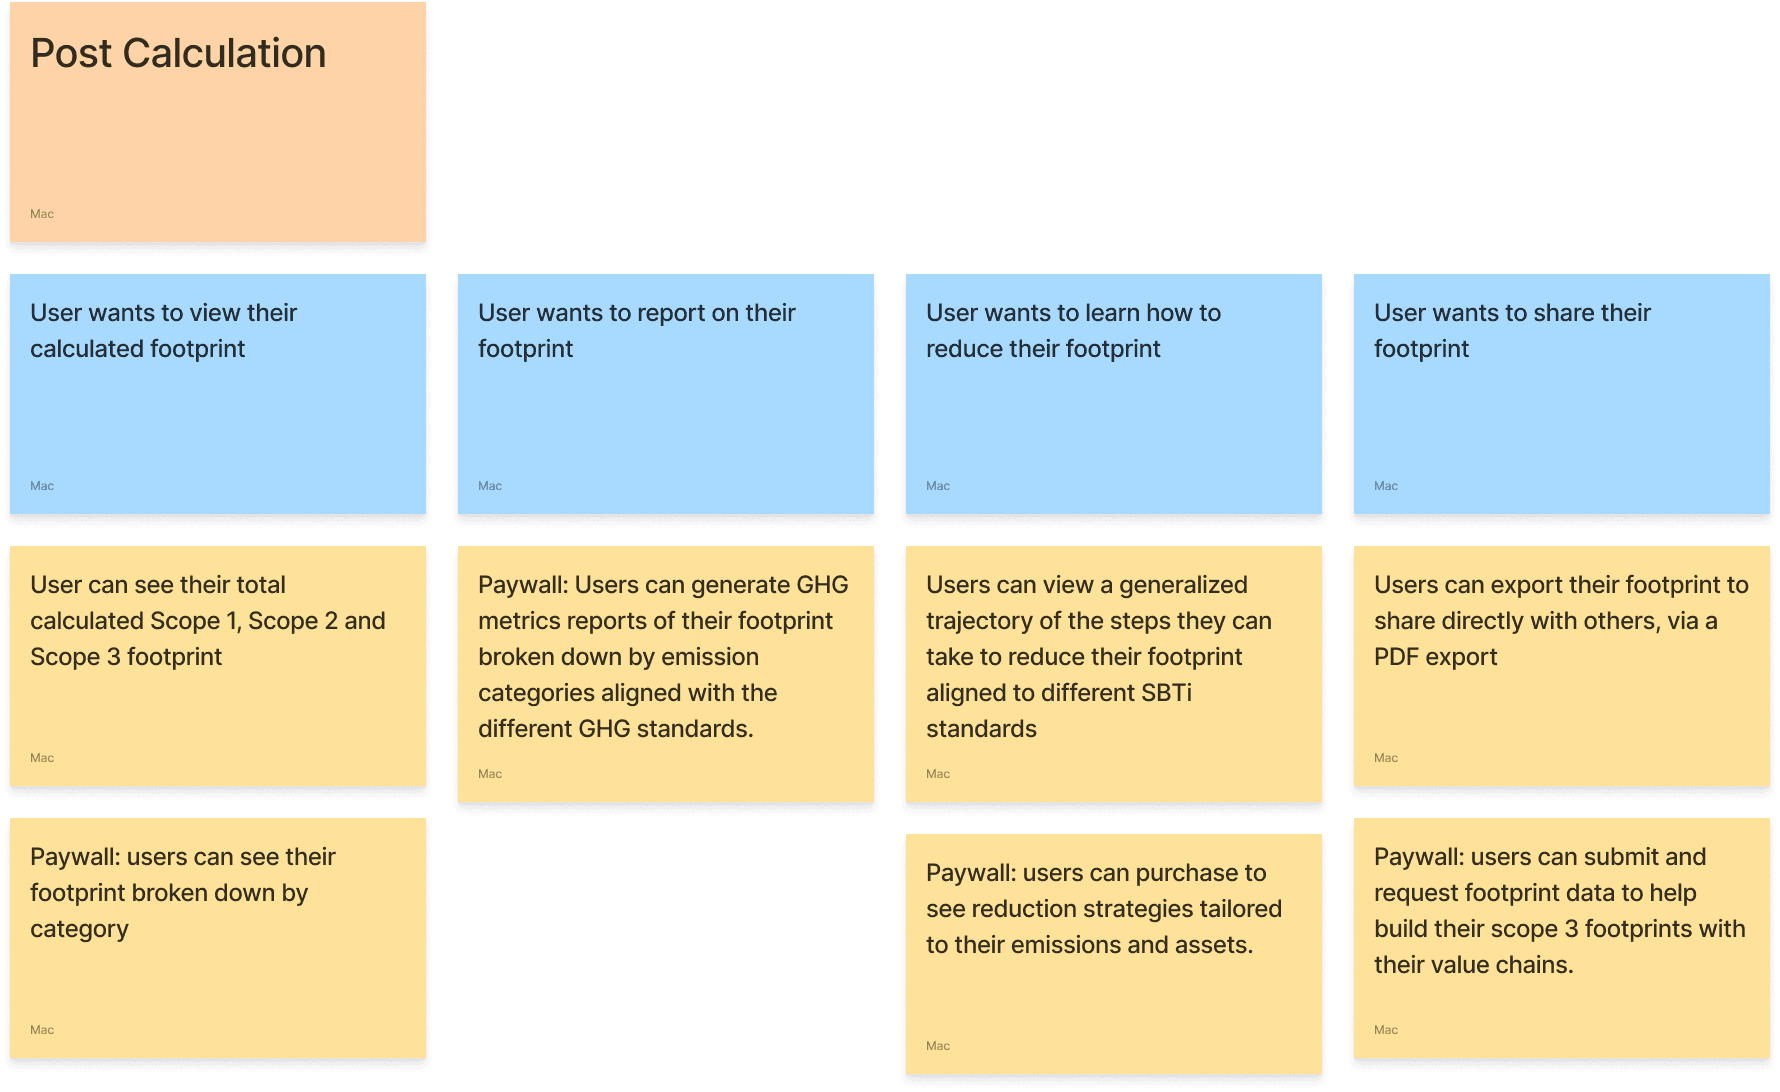
I take notes in a spreadsheet during interviews, then import them into FigJam for affinity mapping.

A view showing a highly detail prototype in Figma

Prototyping

Prototyping

At Persefoni, we always built high-fidelity designs alongside clickable prototypes. Every major feature was fully navigable from start to finish, with defined micro-interactions. This approach:

  • Gave engineers a clear reference

  • Helped us catch UX issues before they got expensive

  • Let stakeholders interact with the experience instead of just reviewing it

Handoff

Handoff

Engineers had been involved early on to stay aligned, but now we needed to turn designs into live software. On this project, I also stepped into a product manager role and wrote tickets for the engineering team.

This turned out to be a huge advantage. I was deeply familiar with the flow and design, so I could write clear and well-scoped tickets. It also helped close the gap between design intent and implementation.

Honestly, one of the best design tools is a well-written Jira ticket.

A graphic representing a design turning into a Jira ticket

Impact

Impact

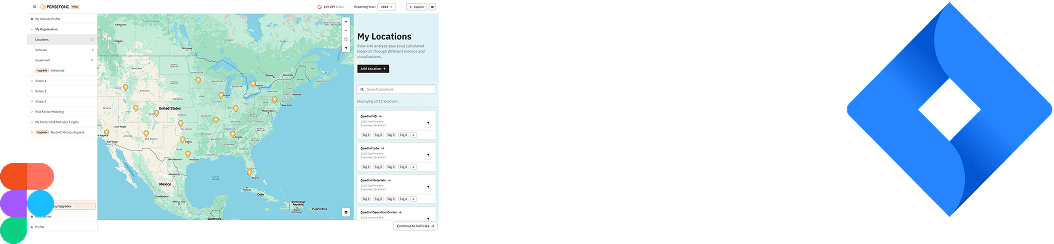
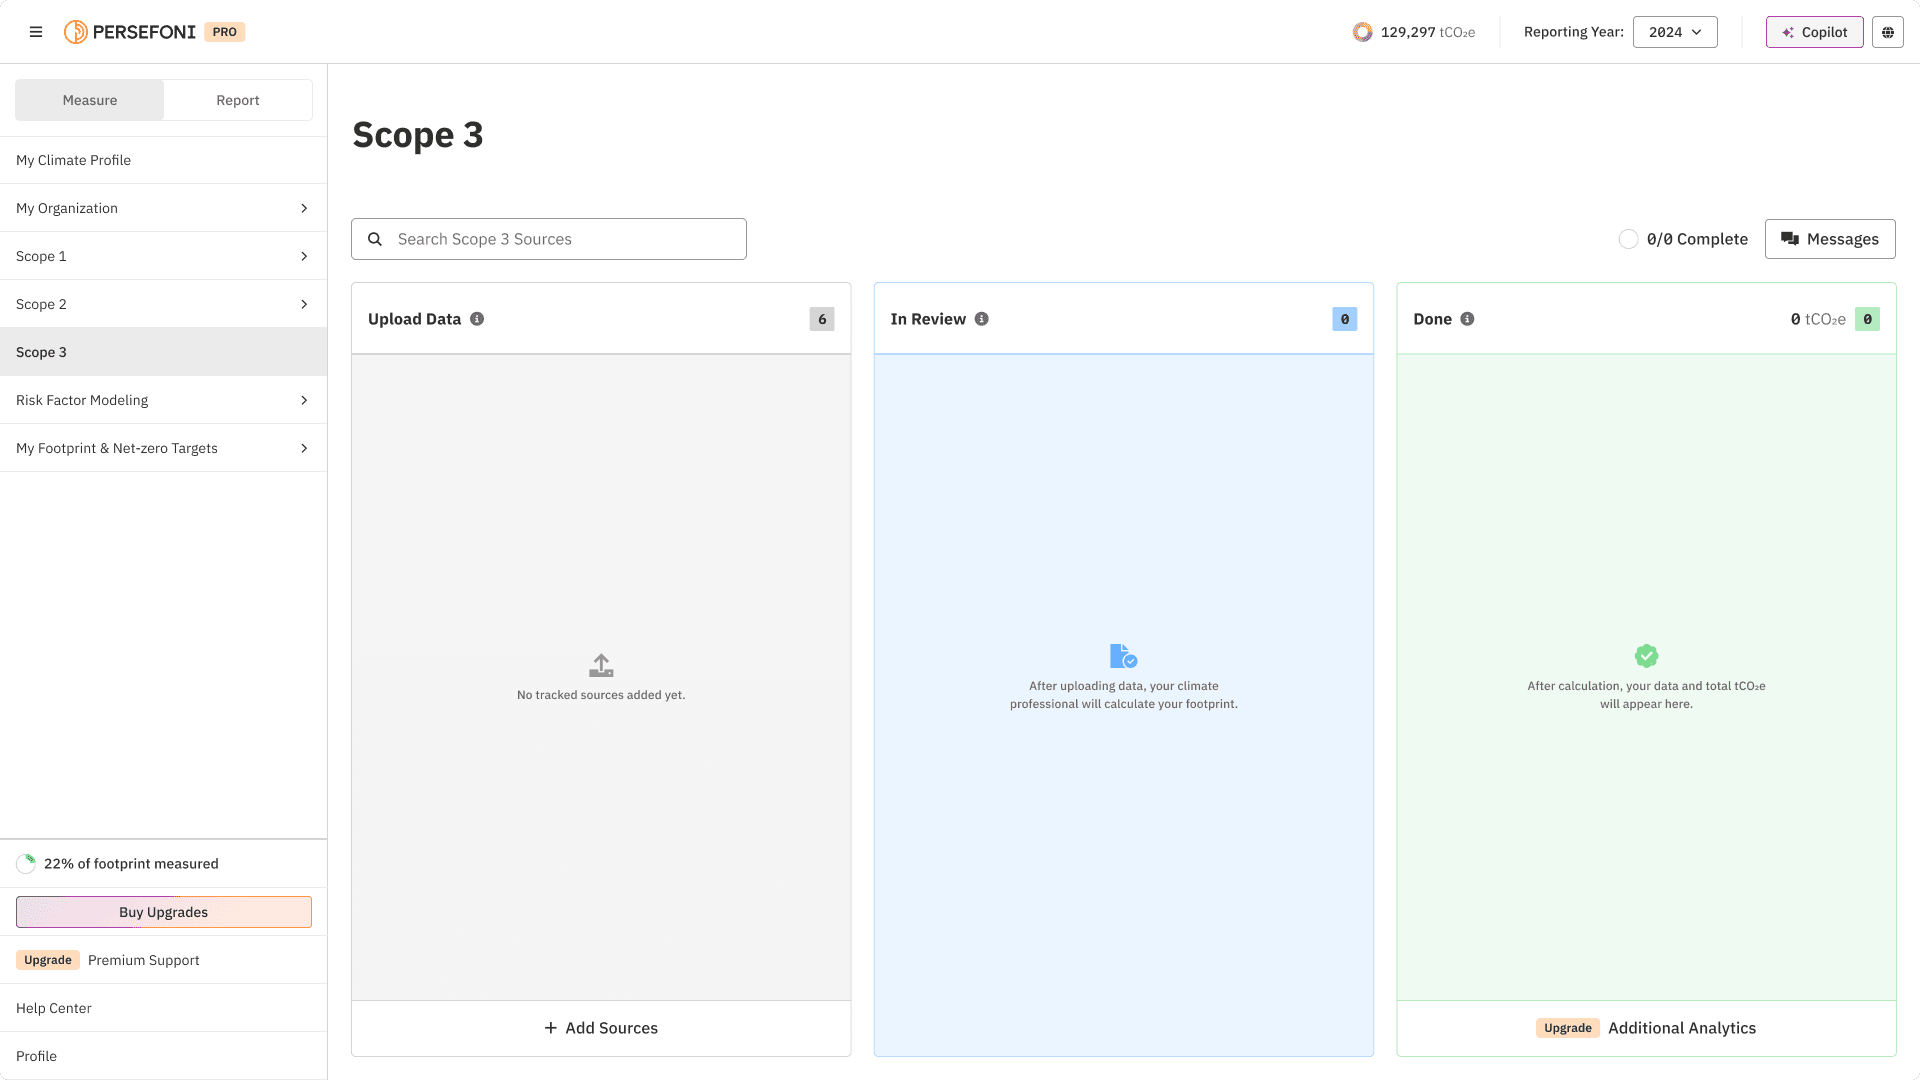
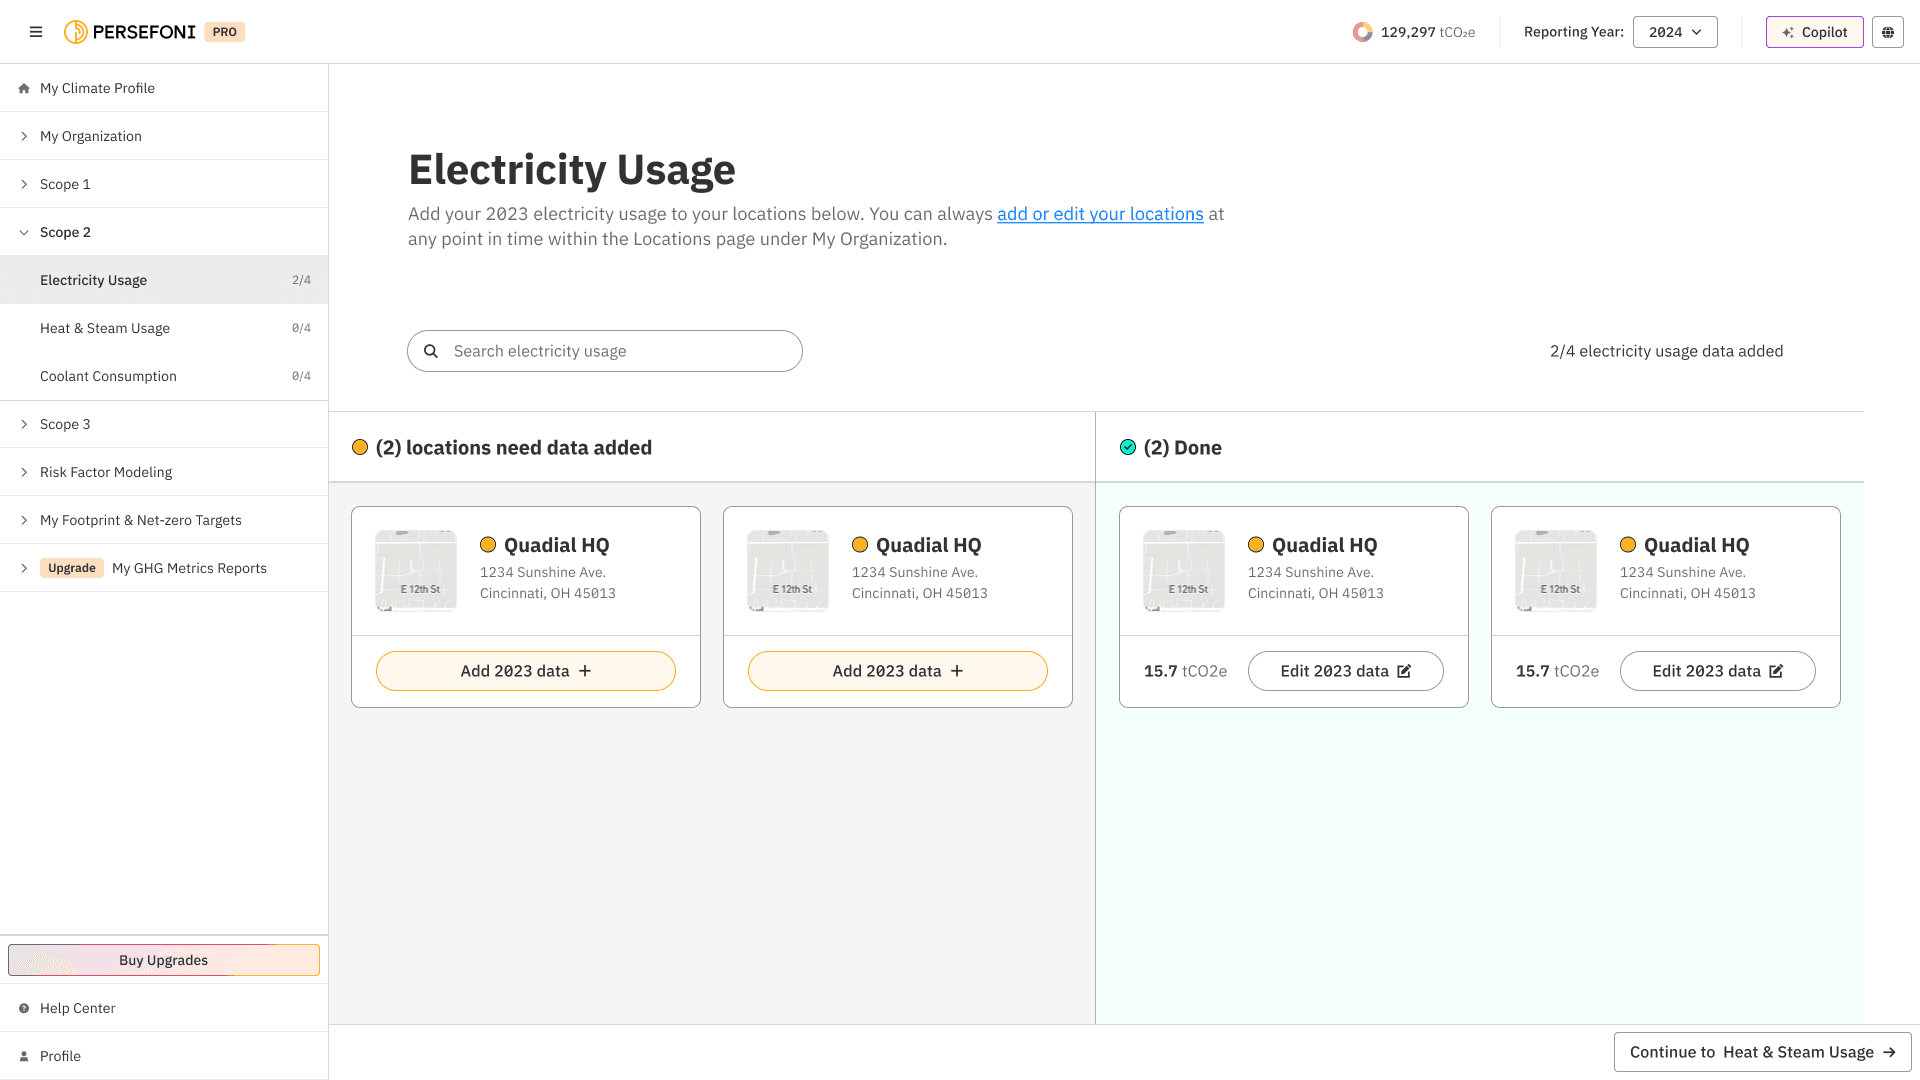
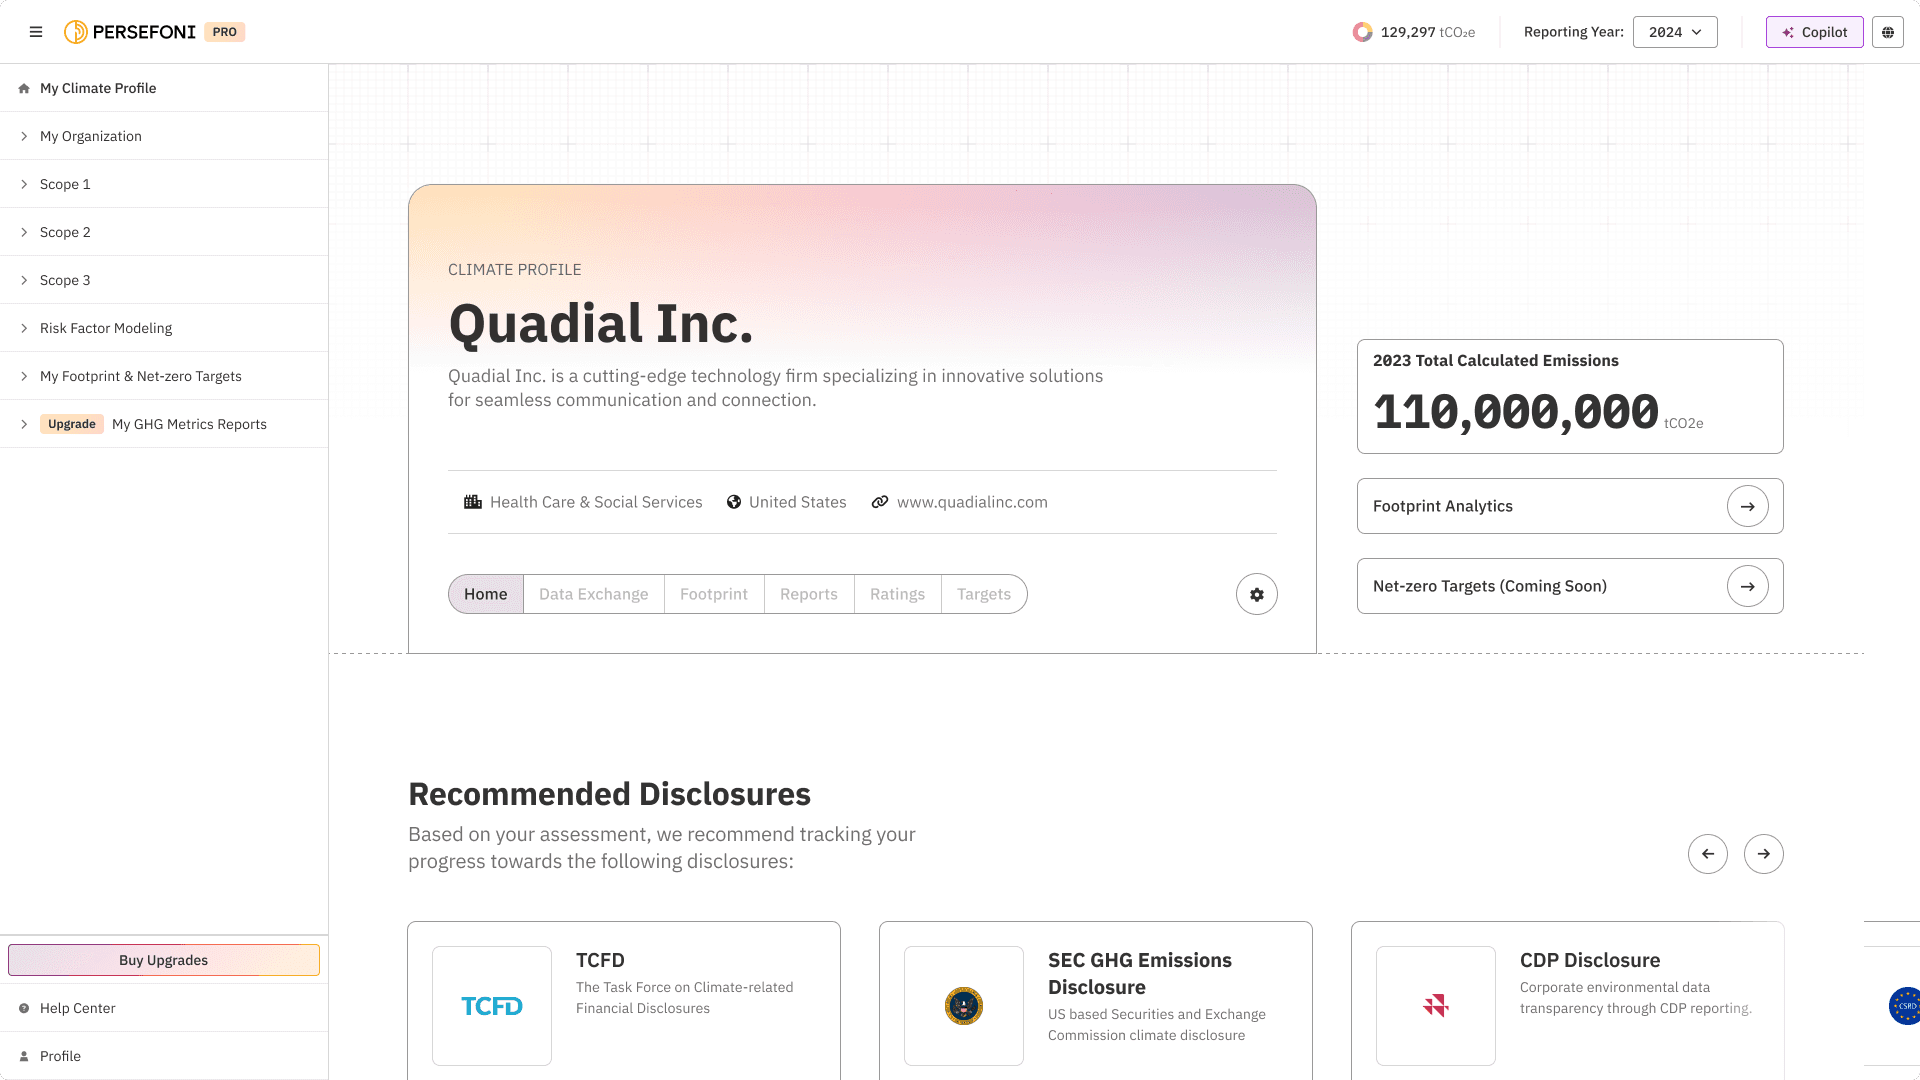
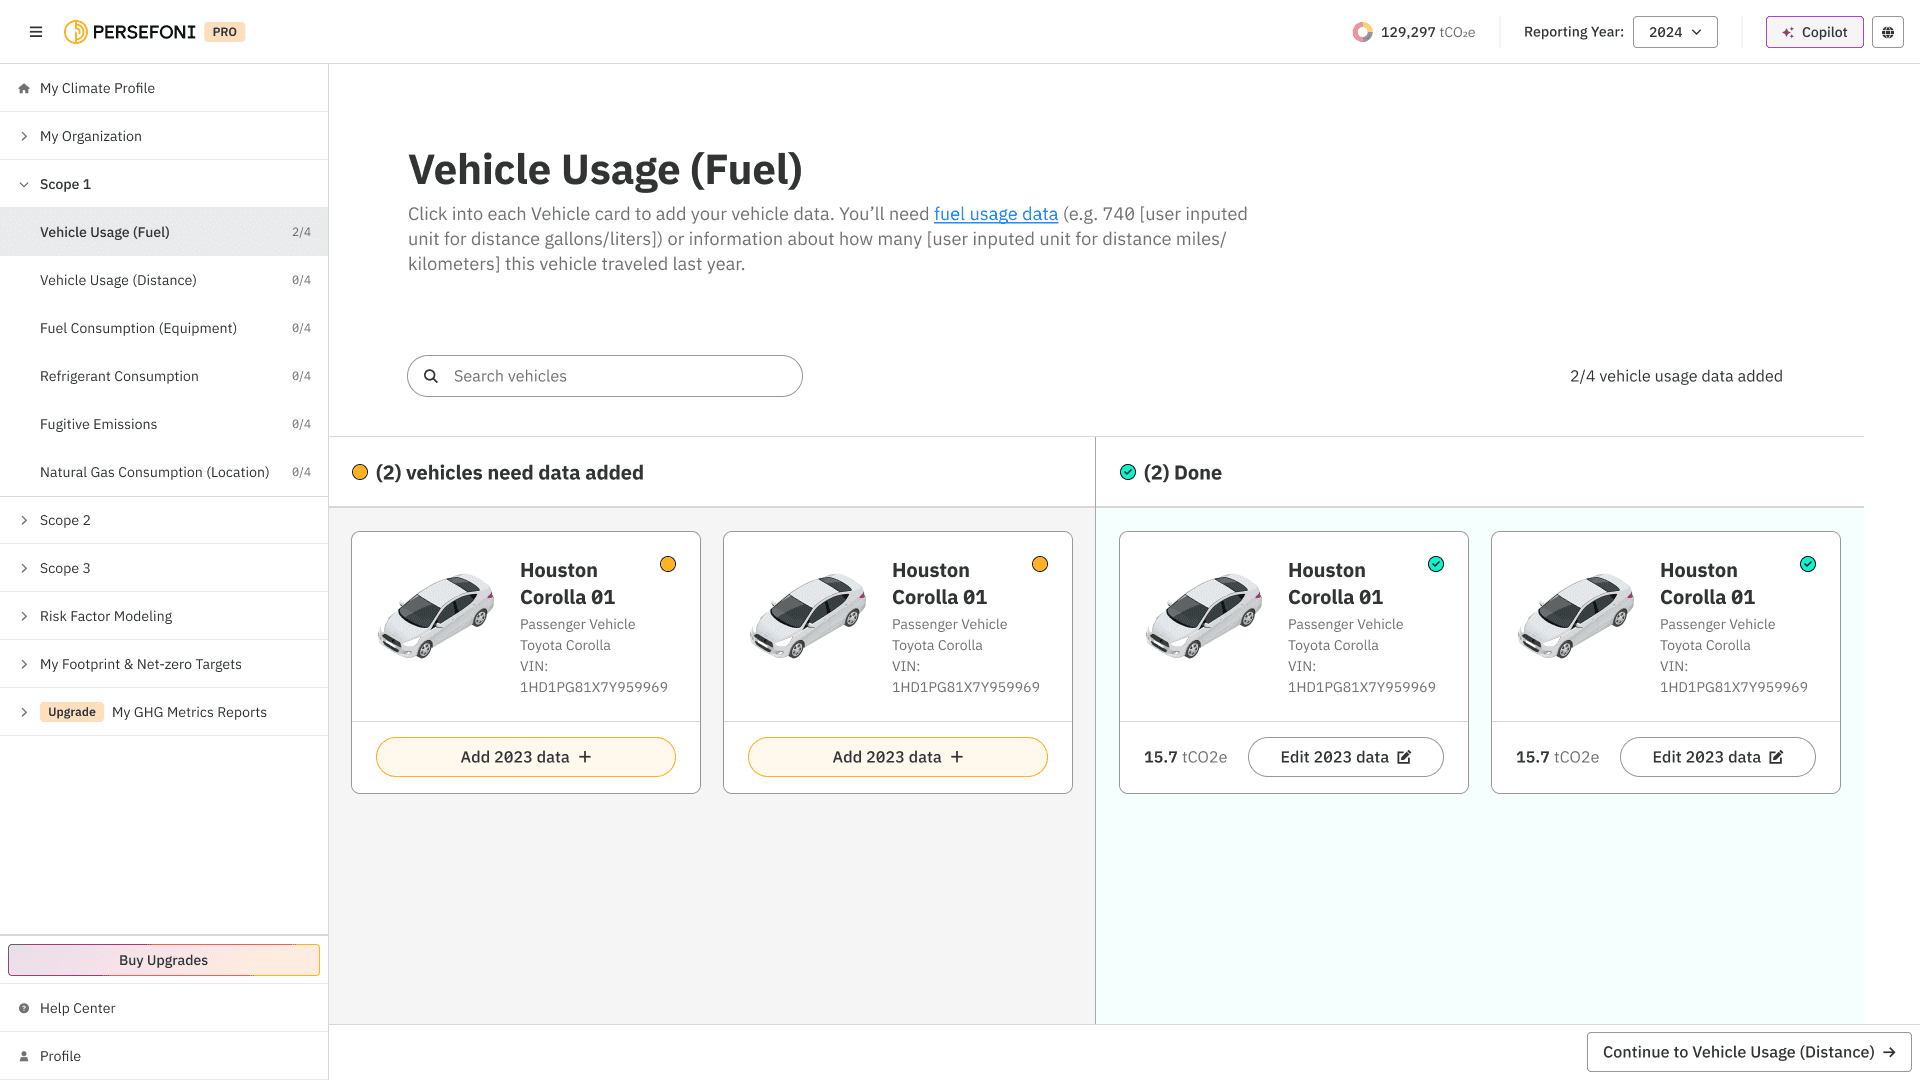
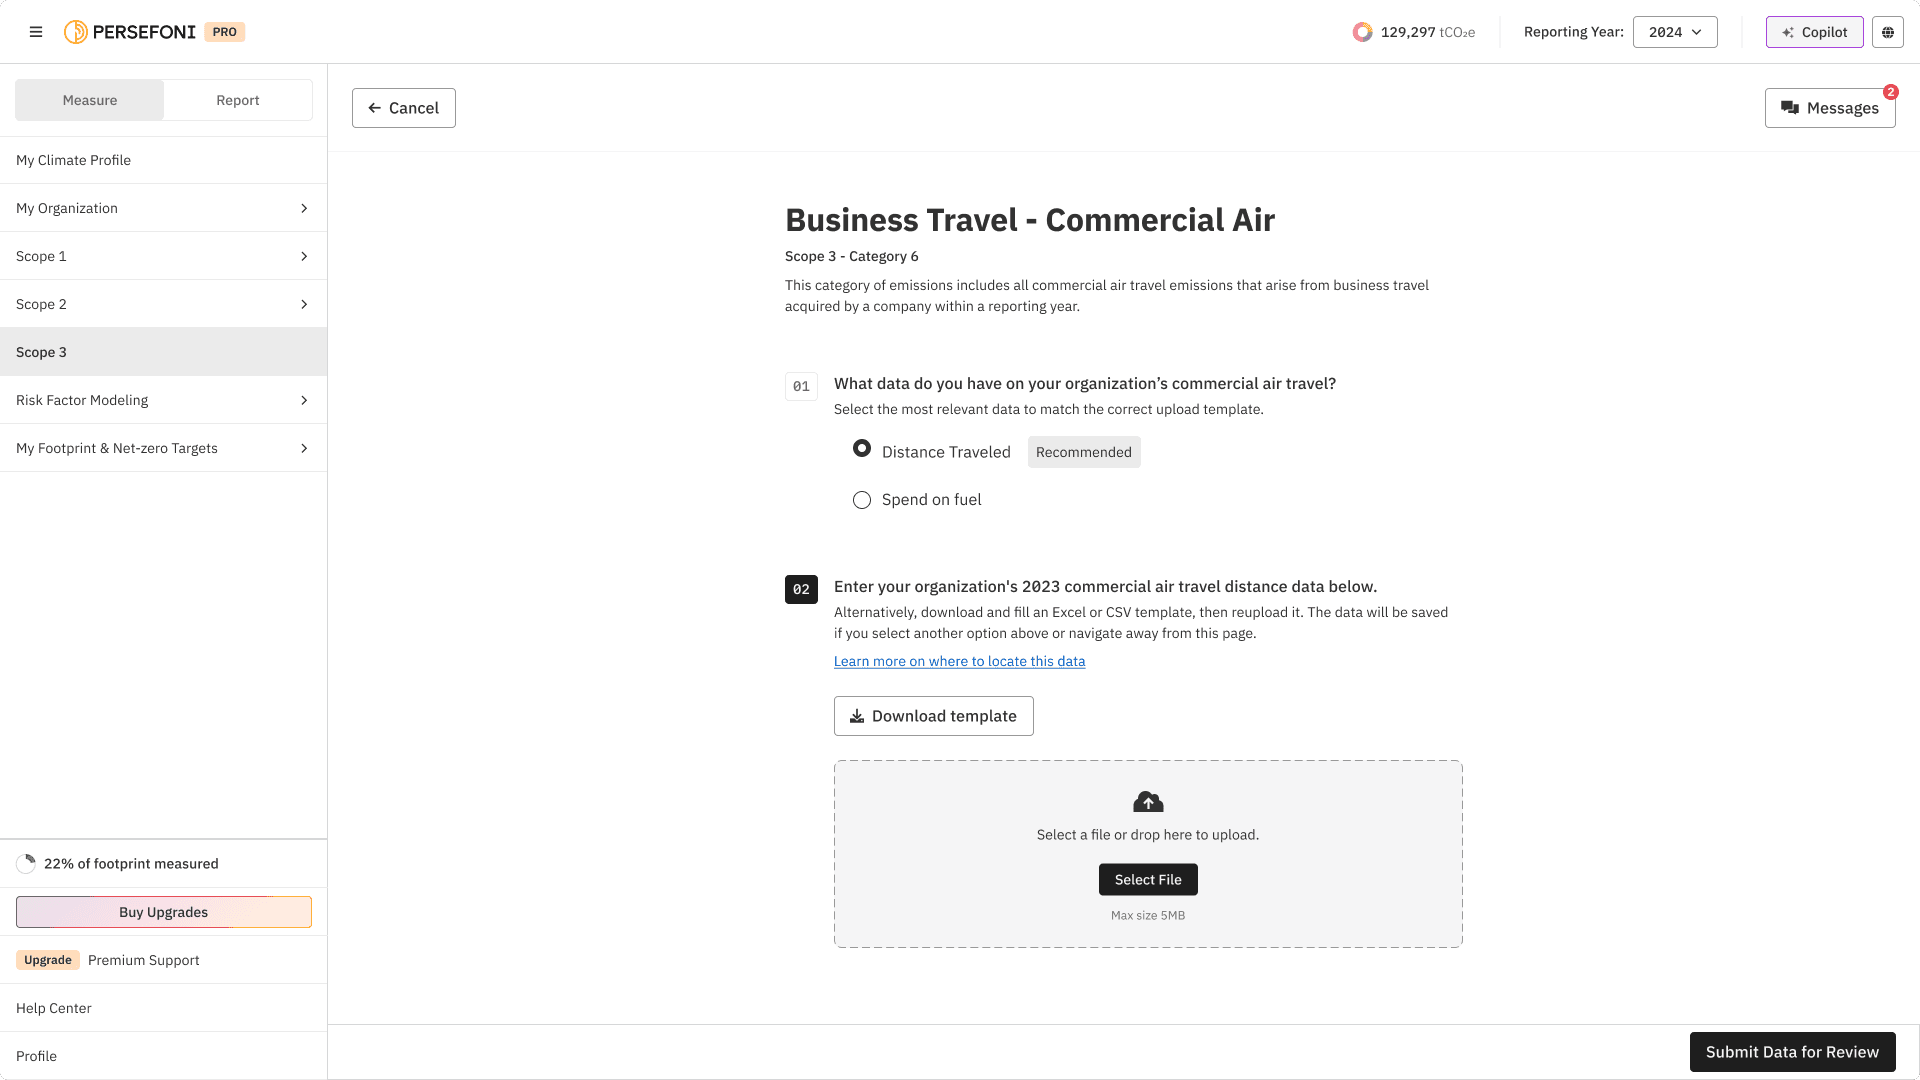
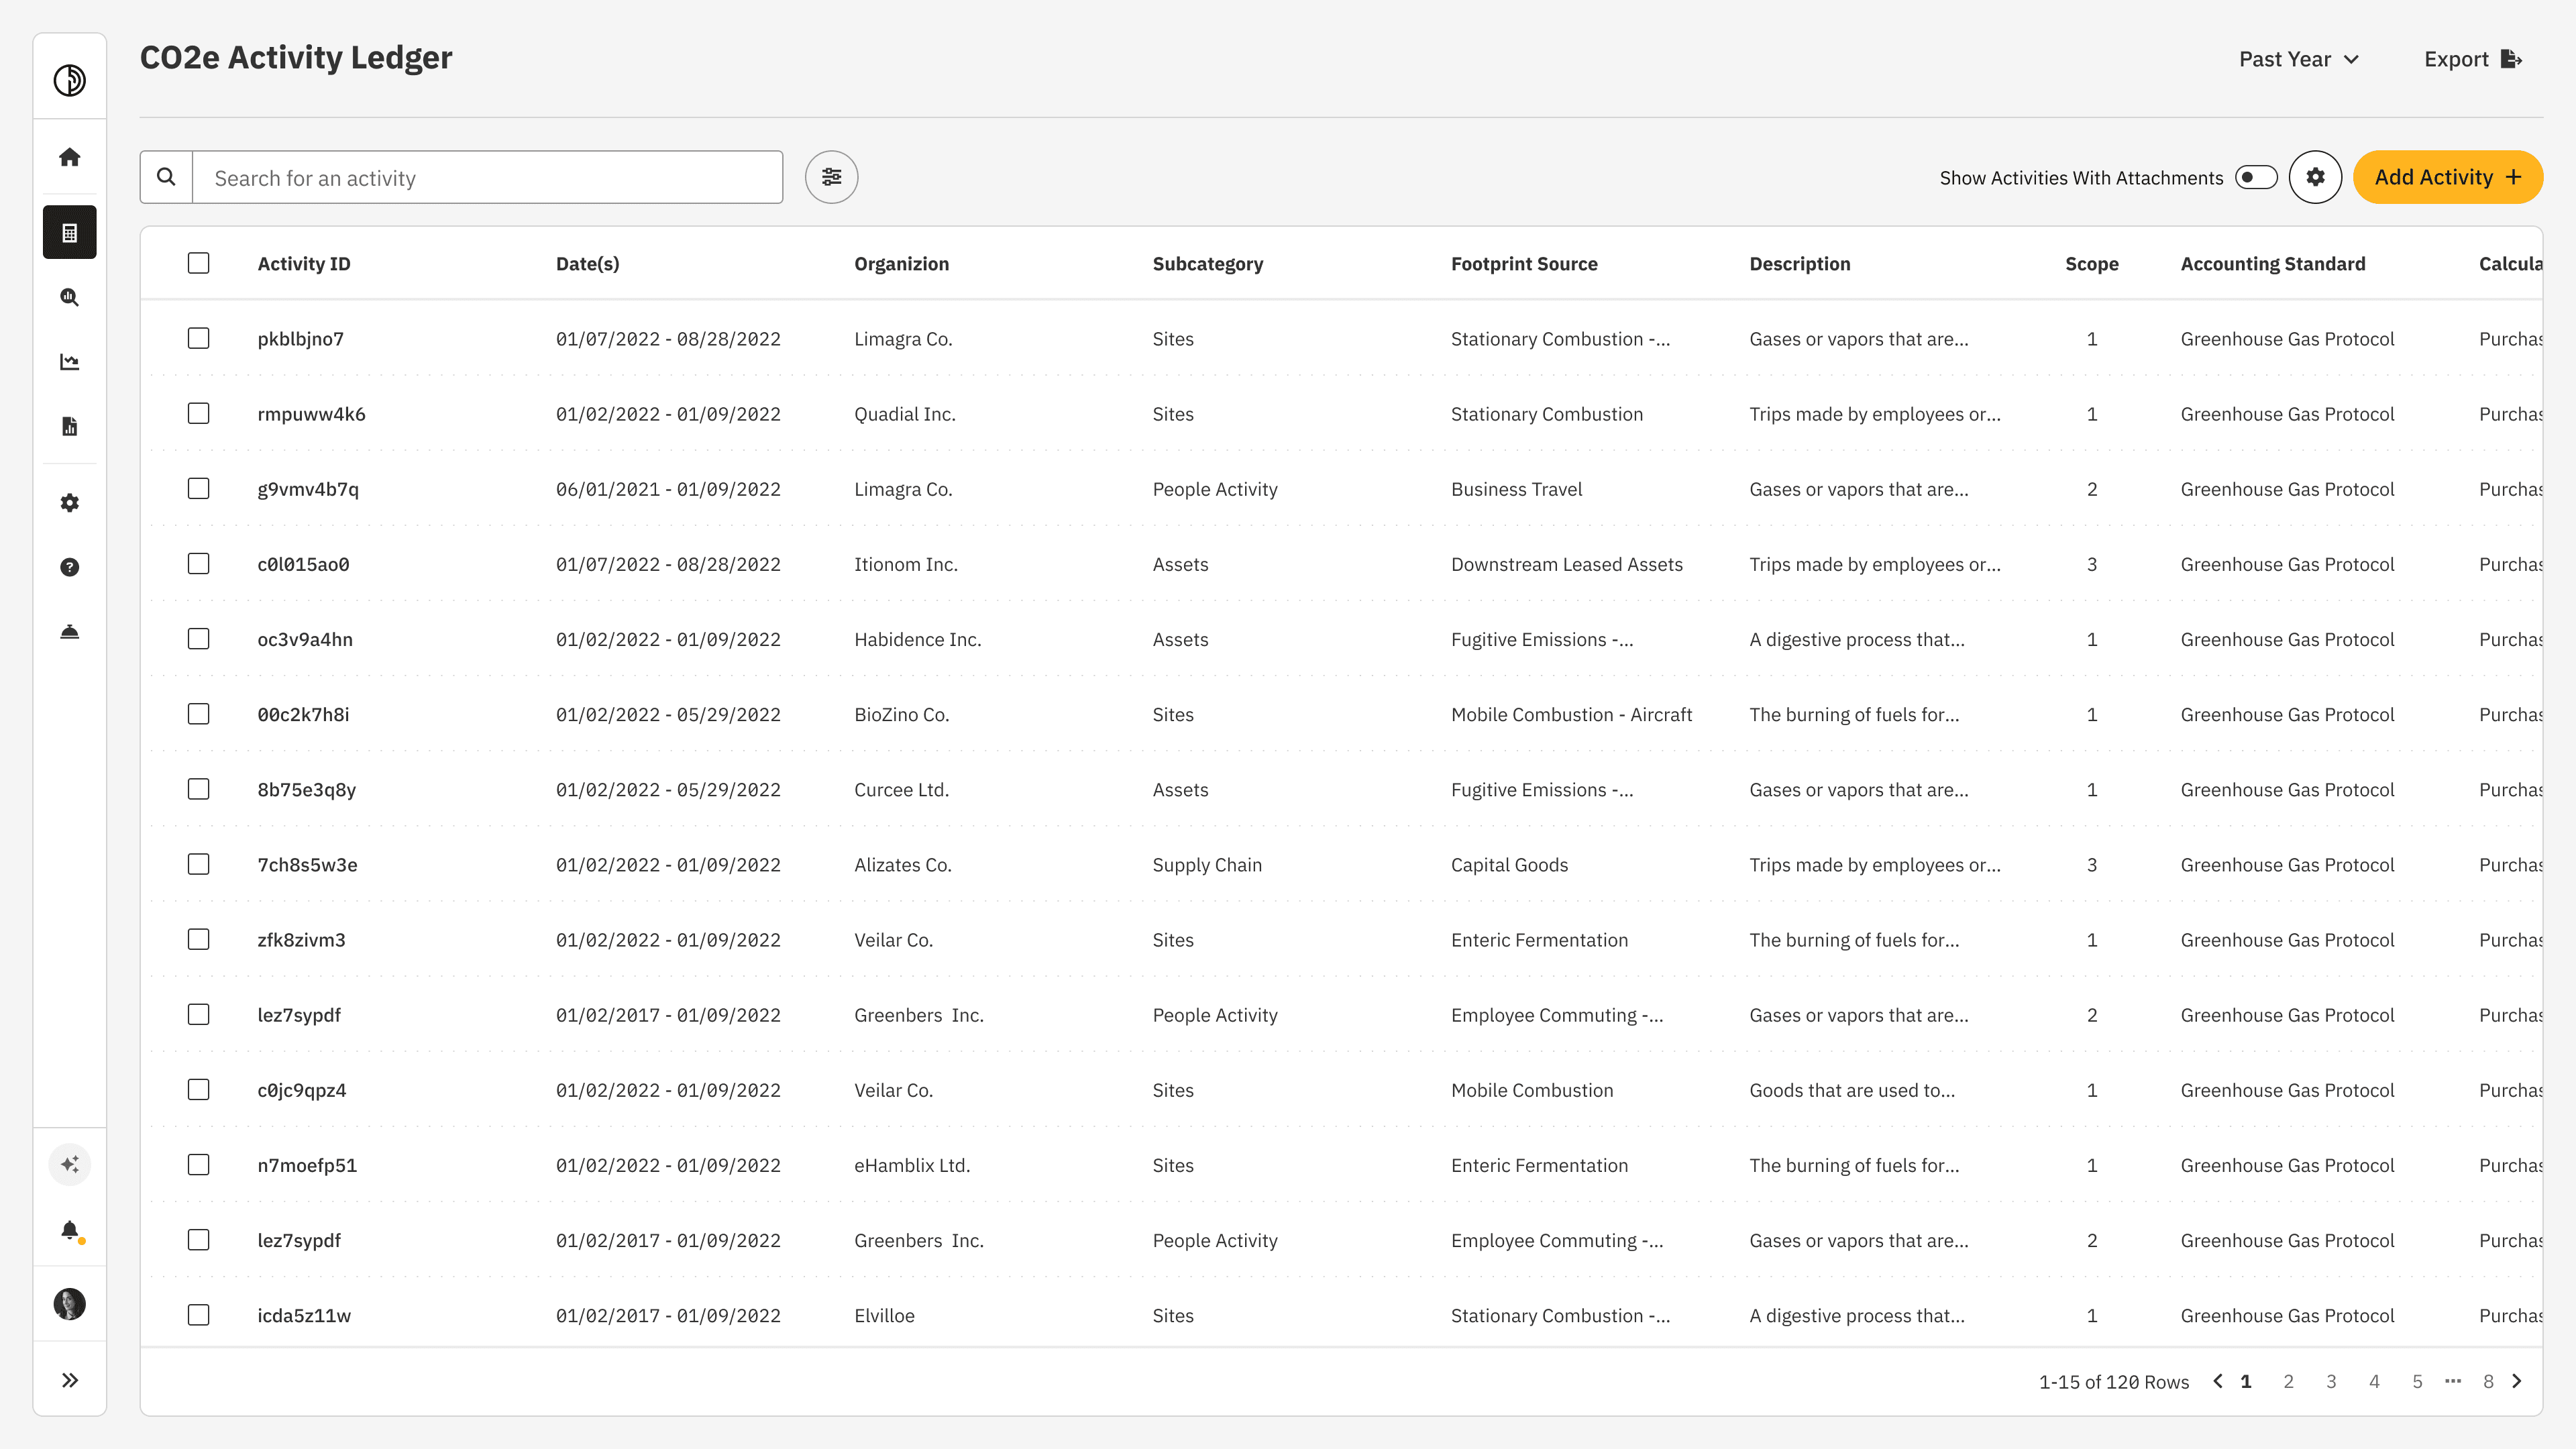
Persefoni Pro, our free carbon accounting tool, launched in Spring 2024, giving organizations an accessible way to measure and manage their emissions.

6,000+ organizations onboarded within the 9 months

Originally targeting 2,000 orgs, we more than tripled our goal, demonstrating a clear demand for streamlined, self-serve carbon accounting—especially among smaller and mid-market companies.

Averaging 500 monthly active users (MAUs)

We doubled our MAU goal, with sustained engagement throughout the year, including spikes around reporting season. This showed that users weren’t just signing up, they were returning regularly to manage and update their data and as we updated the tool with new functionality.

Consistent user feedback highlighting clarity and ease-of-use

Users praised Persefoni Pro for its ease of use and appreciated the guided workflows and intuitive UI. This qualitative signal reinforced that we were solving real pain points and delivering meaningful value.

Users said

"Persefoni Pro simplified something I thought I was going to spend weeks on. Since then, it’s refocused us on what we’re going to do next.”

"Measuring our Scope 3 emissions was incredibly easy with Persefoni Pro. It made a daunting task much more manageable! We were especially impressed with the level of detail provided."

“The simplicity of Pro allows for more streamlined and comparable calculations.”

"It was very easy to use and makes the task of calculating greenhouse gas emissions very palatable, so thank you."

"This was so easy to use. It was practically effortless on our end."

Let's Keep Chatting

If you'd like to talk more, reach out on

A headshot style image of an experienced product designer named Mac McCormick

Let's Keep Chatting

Reach out on

A headshot style image of an experienced product designer named Mac McCormick

Let's Keep Chatting

If you'd like to talk more, reach out on

A headshot style image of an experienced product designer named Mac McCormick